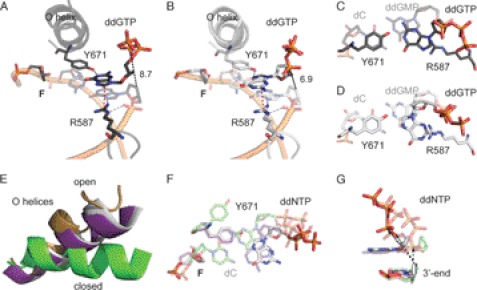
FIGURE 2.
Structure of KlenTaqF-G-I (black) and KlenTaqF-G-II (gray). A, stabilization network of ddGTP in KlenTaqF-G-I. The amino acid side chains Arg-587 and Tyr-671 are labeled. Gray, red, and black dashed lines indicate hydrogen-bonding interactions, cation-π interaction, and distance (Å), respectively. B, the same as in A for KlenTaqF-G-II. C, top view of the nascent base pair opposite F (KlenTaqF-G-I). In the front, the incoming ddGTP opposite Tyr-671 is depicted. The first nucleobase pair of the primer/template terminus is shown as transparent. D, same view as in C for KlenTaqF-G-II. E, the O helices from the superimposition of KlenTaqF-G-II (gray), KlenTaqF-A (purple), KlenTaqC-G (green), and KlenTaqopen (gold) are highlighted. F, comparison of the nascent base pairs of KlenTaqF-G-II (gray), KlenTaqF-A (purple), and KlenTaqC-G (green). G, the incoming ddNTPs of KlenTaqF-G-II (gray), KlenTaqF-A (purple), and KlenTaqC-G (green) and the respective 3′-primer terminus are shown. The arrow indicates the displacement of the α-phosphate regarding to the 3′-primer terminus.

