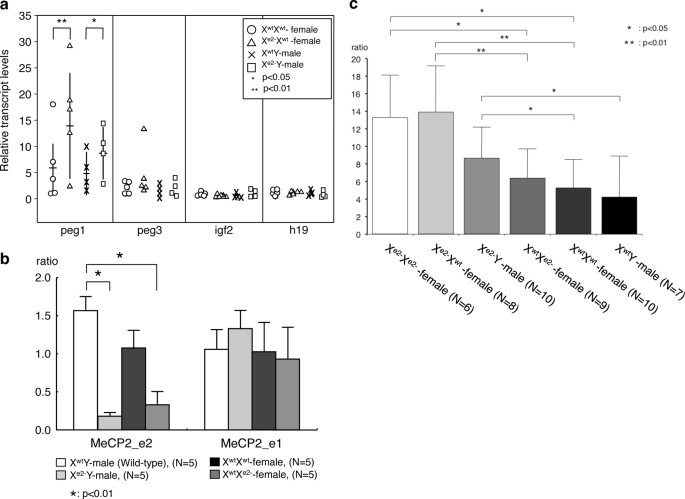
FIGURE 5.
Quantitative PCR analysis of placenta. Shown are (a) placenta transcript levels of selected imprinted genes, peg-1, peg-3, igf-2, and h19, from 13.5 dpc embryos and (b) placenta transcript levels of peg-1 in MeCP2_e2 and MeCP2_e1 (two-isoform knockout) mutants. The horizontal and vertical bars of peg-1 transcripts (a) show averages and S.D. of each genotype, respectively. c, peg-1 expression in placentas of various genotypes. Maternally derived Xe2− allele up-regulated peg-1 expression. *, p < 0.05; **, p < 0.001. Brackets and asterisks indicate significant differences. Error bars, S.D.

