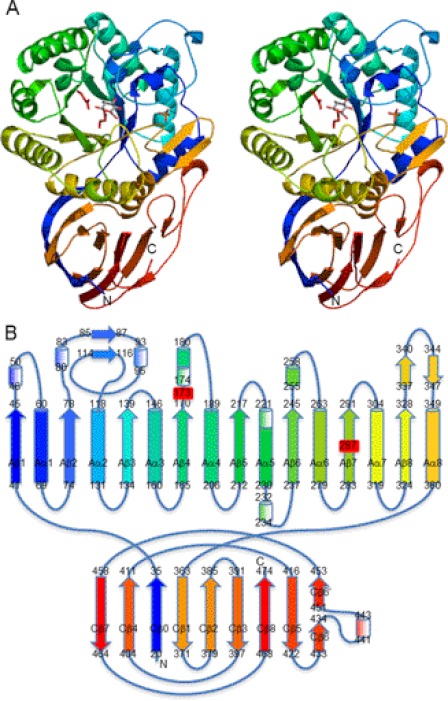
FIGURE 1.
Structure of AcGlcA79A. A, stereoview of the ribbon model of AcGlcA79A-GlcA complex in rainbow-ordered colors. Two catalytic residues are displayed in red. The bound GlcA molecule and phosphate ion are shown as stick models. B, schematic topological diagram of AcGlcA79A. α-Helices are shown as cylinders, α310-helices are shown as shaded cylinders, and β-strands are shown as arrows. The colors correspond to those in A. Two catalytic residues are labeled in red.

