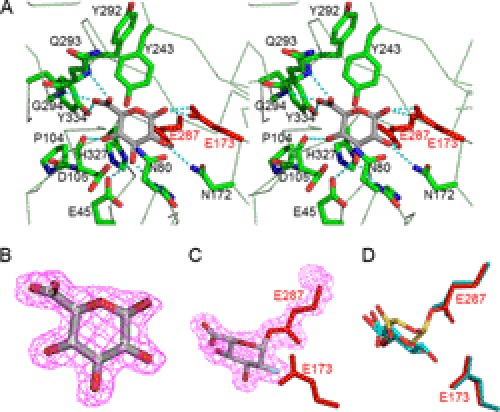
FIGURE 2.
Ligand-binding structure of AcGlcA79A. A, stereoview of the catalytic pocket of AcGlcA79A complexed with glucuronic acid. B, electron density for bound GlcA. Carbon atoms of GlcA are numbered. C, electron density for covalently bound 2FGlcA. D, superimposed model of the bound GlcA (yellow and red) and covalently bound 2FGlcA (cyan and red).

