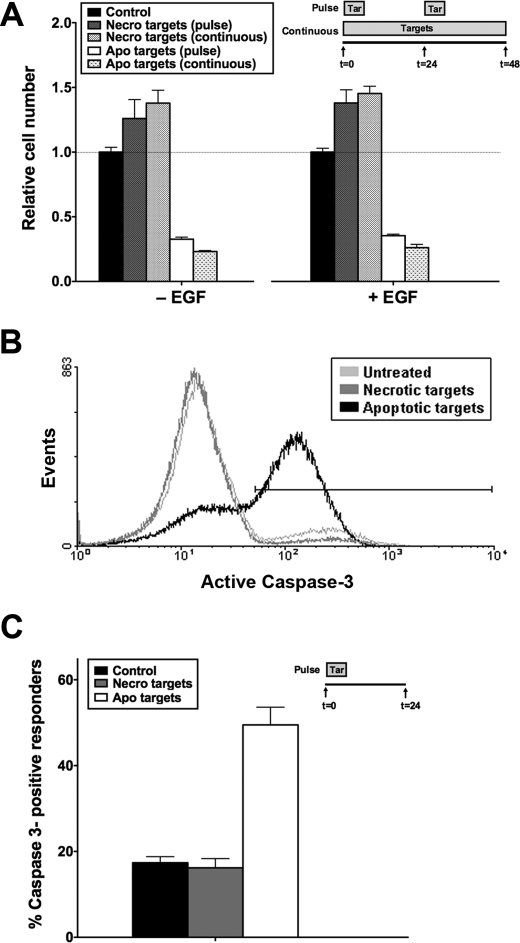
FIGURE 1.
Apoptotic targets decrease viability of BU.MPT responder cells through induction of responder cell apoptosis. A, serum-starved BU.MPT responder cells in the presence or absence of EGF (50 nm) were exposed to apoptotic (Apo) or necrotic (Necro) targets at a target/responder cell ratio of 10:1 either continuously or as two 30-min pulses 24 h apart, as depicted in the inset. The source of apoptotic targets was actinomycin D-treated DO11.10 cells. After 48 h, relative cell number was determined by MTT assay. A570/650 values were normalized against those for responder cells not exposed to targets. Each data point in the graph represents the mean and S.E. from a minimum of three separate experiments. The viability of control responders was well maintained over the experimental period. As compared with freshly confluent responders at 0 h, the relative cell number for control responders at 24 and 48 h was 86.3 ± 5.0 and 75.1 ± 5.8%, respectively. Absolute A570/650 values after 48 h for control responders not exposed to targets in the absence or presence of EGF were 0.784 ± 0.026 and 0.742 ± 0.021, respectively. All experimental A570/650 values were normalized to these values as represented by the dotted line at relative cell number equal to 1.0. p < 0.00001, apoptotic targets (pulse) and apoptotic targets (continuous) versus control in the absence and presence of EGF; p < 0.05, necrotic targets (continuous) versus control in the absence and presence of EGF. B, serum-starved BU.MPT responder cells were exposed to apoptotic (Apo) or necrotic (Necro) targets at a target/responder cell ratio of 10:1 for 30 min. The source of apoptotic targets was staurosporine-treated DO11.10 cells. Induction of apoptosis in BU.MPT responders was assessed 24 h after exposure by cytofluorimetric analysis of permeabilized responders for activated caspase-3. C, the graph depicts the mean and S.E. from three separate cytofluorimetric analyses of the percentage of BU.MPT responder cells positive for activated caspase-3. p < 0.00001, apoptotic targets versus control; p = not significant, necrotic targets versus control. Tar, target(s). Error bars (A and C) denote S.E.

