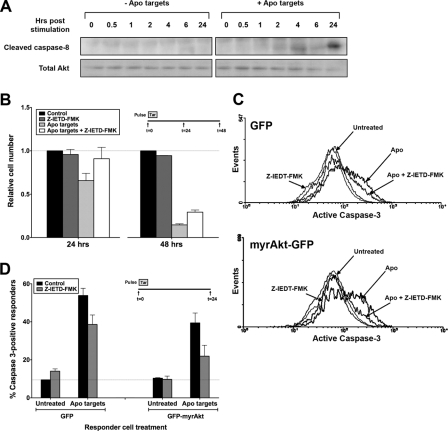
FIGURE 11.
Apoptotic targets activate caspase-8 in BU.MPT responders. A, serum-starved BU.MPT responder cells were exposed to vehicle or apoptotic targets (Apo) at a target/responder cell ratio of 10:1 for 30 min. The source of apoptotic targets was staurosporine-treated BU.MPT cells. At the indicated times following stimulation (t = 0), non-adherent cells were removed by washing, and responder cell lysates were probed with anti-cleaved caspase-8 antibody as shown. Equal loading was confirmed by Ponceau S staining of blotted proteins as well as by probing for total Akt. B, serum-starved BU.MPT responder cells in the presence or absence of the caspase-8 inhibitor Z-IEDT-fmk (200 μm) were exposed to apoptotic (Apo) targets at a target/responder cell ratio of 10:1 in a single 2-h pulse, as depicted in the inset. The source of apoptotic targets was actinomycin D-treated DO11.10 cells. After 24 or 48 h, relative cell number was determined by MTT assay. A570/650 values were normalized against those for responder cells not exposed to targets. Each data point in the graph represents the mean and S.E. from a minimum of three separate experiments. Absolute A570/650 values for responder cells unexposed to targets and in the absence of Z-IEDT-fmk at 24 and 48 h were 0.566 ± 0.078 and 0.661 ± 0.075, respectively. All experimental A570/650 values were normalized to these values as represented by the dotted line at relative cell number equal to 1.0. p < 0.05, apoptotic targets + Z-IEDT-fmk versus apoptotic targets at 24 and 48 h. C, BU.MPT responder cells were transiently infected with retroviral constructs containing either GFP alone (GFP) or GFP plus constitutively active myristoylated Akt (GFP-myrAkt). Serum-starved infected BU.MPT responders in the presence or absence of Z-IEDT-fmk (200 μm) were left untreated (Untreated) or exposed to apoptotic (Apo) targets at a target/responder cell ratio of 10:1 for 30 min. The source of apoptotic targets was staurosporine-treated DO11.10 cells. Induction of apoptosis in BU.MPT responders was assessed 24 h after exposure to targets by cytofluorimetric analysis of permeabilized responders for activated caspase-3. D, the graph depicts the mean and S.E. from three separate cytofluorimetric analyses of the percentage of BU.MPT responder cells positive for activated caspase-3. In all cases, cytofluorimetric analysis was restricted to infected BU.MPT responders whose GFP fluorescence was >1000× that of uninfected cells. The dotted line represents the percentage of caspase 3-positive responders in untreated BU.MPT responders infected with GFP alone. p < 0.01, Z-IEDT-fmk versus control, apoptotic targets, GFP-infected responders; p < 0.01, Z-IEDT-fmk versus control, apoptotic targets, myrAkt-GFP-infected responders; p < 0.01, apoptotic targets in the absence of Z-IEDT-fmk, GFP- versus myrAkt-GFP-infected responders; p < 0.005, apoptotic targets in the presence of Z-IEDT-fmk, GFP- versus myrAkt-GFP-infected responders. Tar, target(s). Error bars (B and D) denote S.E.

