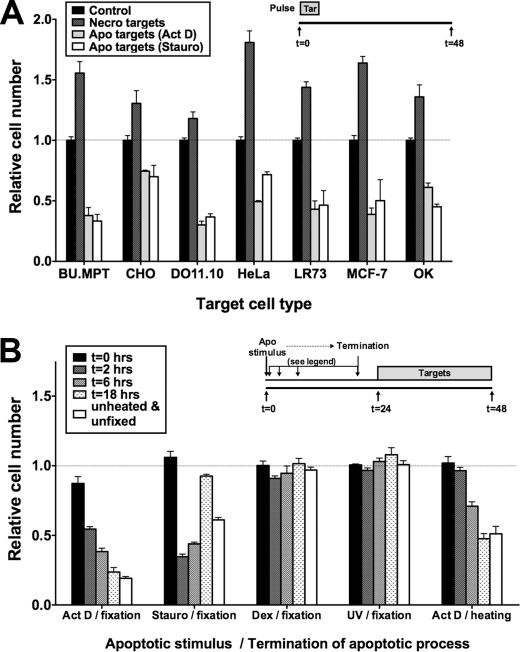
FIGURE 4.
Mode of induction of apoptosis, but not cellular origin, influences effect of apoptotic targets on responder cells. A, serum-starved BU.MPT responder cells were exposed to apoptotic (Apo) or necrotic (Necro) targets from the indicated cell lines at a target/responder cell ratio of 10:1 for 2 h. The source of apoptotic targets was actinomycin D-treated (Act D) or staurosporine-treated (Stauro) DO11.10 cells. p < 0.001, apoptotic targets (actinomycin D) and apoptotic targets (staurosporine) versus control for all target cell types; p < 0.0001, necrotic targets versus control for all target cell types. B, serum-starved BU.MPT responder cells were exposed to apoptotic (Apo) targets at a target/responder cell ratio of 10:1 continuously for 24 h. Apoptosis of DO11.10 target cells was induced by treatment with actinomycin D (Act D), staurosporine (Stauro), dexamethasone (Dex), or ultraviolet irradiation (UV) and terminated by fixation or heating at the indicated times following the apoptotic stimulus, as depicted in the inset. p < 0.01, actinomycin D/fixation versus control for all times except 0 h; p < 0.001, staurosporine/fixation versus control for all times except 0 and 18 h; p < 0.001, actinomycin D/heating versus control for all times except 0 and 2 h; p = not significant, dexamethasone/fixation and UV/fixation versus control for all times. A and B, relative cell number was determined by MTT assay. A570/650 values were normalized against those for BU.MPT responder cells not exposed to targets as represented by the dotted line at relative cell number equal to 1.0. Each data point in the graphs represents the mean and S.E. from a minimum of three or more separate experiments. Absolute A570/650 values for control responders unexposed to targets were 0.515 ± 0.015 and 0.595 ± 0.026 in A and B, respectively. All experimental A570/650 values were normalized to these values. Tar, target(s). Error bars (A and B) denote S.E.

