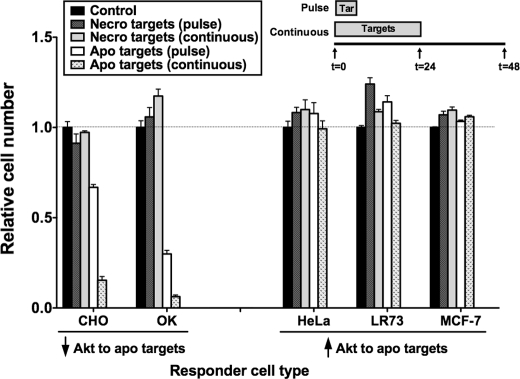
FIGURE 8.
Viability response of epithelial responders to apoptotic targets varies with responder tissue of origin but correlates with responder Akt response. Serum-starved responders from the indicated epithelial cell lineages were exposed to apoptotic (Apo) or necrotic (Necro) targets at a target/responder cell ratio of 10:1 either continuously for 24 h or as a single 2-h pulse, as depicted in the inset. The source of apoptotic targets was actinomycin D-treated DO11.10 cells. After 48 h, relative cell number was determined by MTT assay. A570/650 values were normalized against those for the appropriate responder cell lineage not exposed to targets. Each data point in the graph represents the mean and S.E. from a minimum of three separate experiments. Responder cell lineages are grouped into those for which exposure to apoptotic targets leads to a decrease of Akt activity and those for which exposure leads to an increase of Akt activity. The tissue origin of these lineages are: kidney (OK), ovary (CHO and LR73), breast (MCF-7), and uterus (HeLa). Absolute A570/650 values for responder cells unexposed to targets were 0.177 ± 0.005 (CHO), 0.155 ± 0.006 (OK), 0.671 ± 0.023 (HeLa), 0.353 ± 0.004 (LR73), and 0.359 ± 0.051 (MCF-7), respectively. All experimental A570/650 values were normalized to these values as represented by the dotted line at relative cell number equal to 1.0. p < 0.05, apoptotic targets (pulse) versus control, CHO, OK, LR73, and MCF-7 responders; p < 0.05, apoptotic targets (continuous) versus control, CHO, OK, and MCF-7 responders; p < 0.05, necrotic targets (pulse) versus control, LR73, and MCF-7 responders; p < 0.05, necrotic targets (continuous) versus control, CHO, LR73, and MCF-7 responders. Tar, target(s). Error bars denote S.E.

