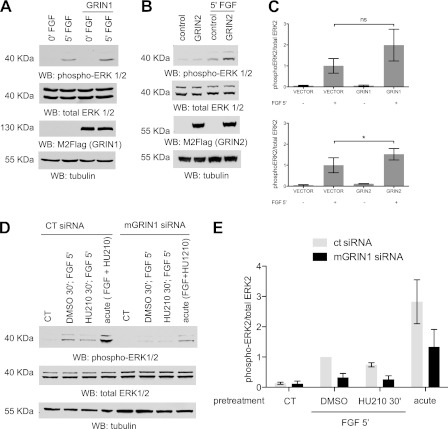
FIGURE 8.
GRIN expression levels modulate MAPK activation by FGF. A, overexpression of GRIN2 enhances FGF stimulation of MAPK. Neuro-2A cells were transfected with either pcDNA3.1 (vector control) or pcDNA3.1 mGRIN2. Eight hours after transfection, cells were serum-starved overnight. They were then treated with FGF (20 ng/ml) for 5 min as indicated. Total cell lysate was immunoblotted (WB) with monoclonal anti-dual phospho-p44/42 ERK1/2 (top panel), polyclonal anti-dual total p44/42 ERK1/2 (second panel), anti-GRIN (third panel) antibody, and anti-tubulin antibody (bottom panel). Representative immunoblots from one of three experiments are shown. B, overexpression of GRIN1 enhances FGF stimulation of MAPK. Neuro-2A cells were transfected with either pcDNA3.1 FLAG (vector control) or pcDNA3.1 FLAG-mGRIN1. Eight hours after transfection, cells were serum-starved with 0.5% FBS modified Eagle's medium for 16 h before stimulation. They were then treated with FGF (40 ng/ml) for 5 min as indicated. Cells were harvested, and 60 μg of total cell lysate was resolved by SDS-PAGE and immunoblotted with monoclonal anti-dual phospho-p44/42 ERK1/2 (top panel), polyclonal anti-dual total p44/42 ERK1/2 (second panel), M2-FLAG (third panel) antibody, and anti-tubulin antibody (bottom panel). Representative immunoblots from one of three experiments are shown. C, densitometric data for the average of three independent experiments of panel B. Error bars indicate S.E. ns, not significant. D, GRIN1 knockdown attenuates FGF stimulation of MAPK. Negative pool siRNA and GRIN1-specific siRNA (Dharmacon) were transfected into Neuro-2A cells. Cells were serum-starved overnight and pretreated with DMSO or HU-210 (500 nm) for 30 min followed by stimulation with FGF (20 ng/ml) for 5 min as indicated. For the acute stimulation, HU-210 (500 nm) and FGF (20 ng/ml) were added simultaneously for 5 min. Whole cell lysate was immunoblotted with monoclonal anti-dual phospho-p44/42 ERK1/2 (top panel), polyclonal anti-dual total p44/42 ERK1/2 (middle panel), and anti-tubulin antibody (bottom panel). Representative immunoblots from one of three independent experiments are shown. CT, control. E, the corresponding densitometric data for the average of three experimental trials are shown. *, p < 0.05. Error bars indicate S.E.

