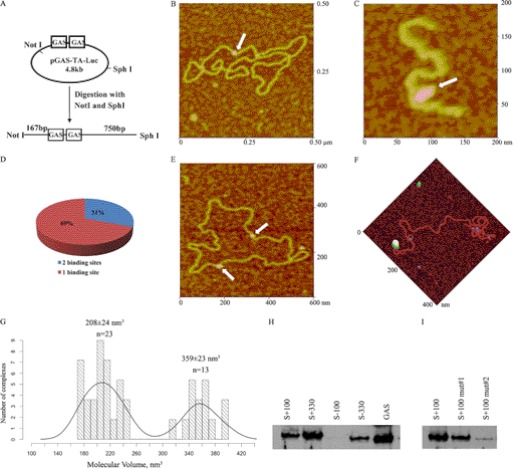
FIGURE 1.
AFM imaging of STAT3 complexes with pGAS-TA-Luc plasmid. A, experimental design for AFM analysis of STAT3 binding to GAS element within pGAS-TA-Luc. B, representative AFM image of full-length STAT3 (white arrow) binding as a monomer to pGAS-TA-Luc. C, full-length STAT3 binding to the GAS element as a dimer (white arrow). D, percent of protein complexes bound to a single site or to two sites on the pGAS-TA-Luc plasmid. E, representative AFM image of STAT3 bound to two sites (white arrows). F, STAT3 binding to the site located at 100 bp from a NotI-digested end. G, histogram of volume distribution of full-length STAT3 measured by AFM. H, STAT3-DNA interactions analyzed by DAPA with a biotinylated double-stranded DNA oligonucleotides corresponding to each of the four potential STAT3 binding sites in the pGAS-TA-Luc plasmid. I, STAT3 binding to AT-rich sequences is decreased by A to G mutations.

