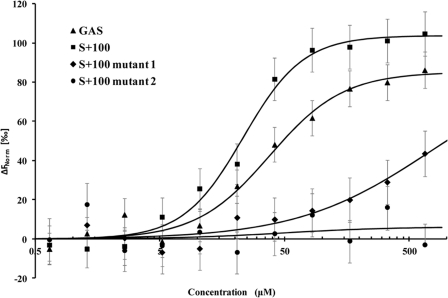
FIGURE 2.
STAT3 binding to DNA. Microscale thermophoresis binding measurements of STAT3-EGFP to GAS (KD = 37.9 ± 1.0 μm), S+100 (KD = 23.3 ± 0.57 μm), S+100 mutant 1 (KD = 740 ± 21 μm), and S+100 mutant 2 (no binding). The data suggests comparable affinities of STAT3 interactions with GAS and AT-rich sequences, whereas A to G substitutions in the S+100 sequence (S+100 mutants 1 and S+100 mutant 2, Table 1) result in dramatically reduced affinity. The lines through the points are the best-fit curves using the Hill equation. The error bars represent standard deviation from three independent measurements.

