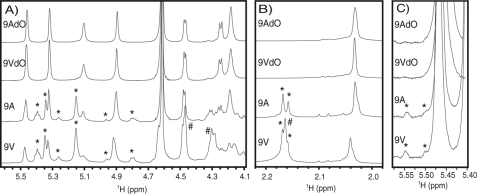
FIGURE 2.
1H NMR spectra of native and de-O-acetylated (dO) 9V and 9A PS. Selected views of the anomeric (A) and acetate (B) regions and a magnified portion of the anomeric region (C) of the 1H NMR spectra in supplemental Fig. S1. Asterisks denote hydrolysis-sensitive signals shared by native 9A and 9V PS, and pound signs denote hydrolysis-sensitive signals observed only in 9V PS.

