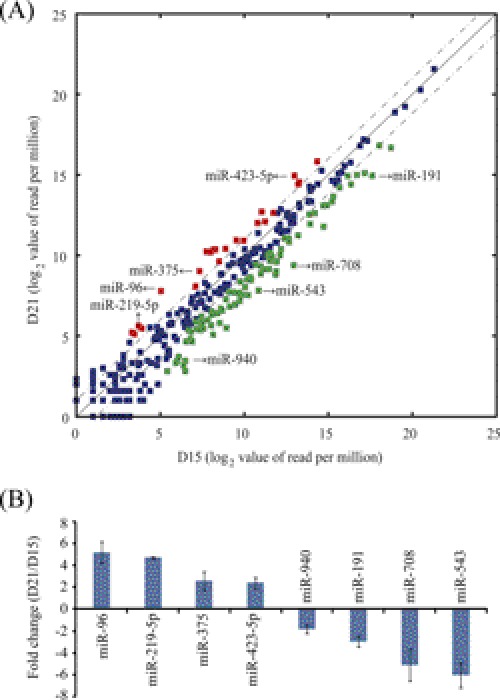
FIGURE 2.
Identification of differentially expressed miRNAs. A, scatter plot represents miRNAs significantly changed at least 2-fold (p < 0.001). The RPM (reads per million) values are plotted in log2 scale. Dash lines indicate the 2-fold difference boundaries. Red dots indicate up-regulated miRNAs, and green dots represent down-regulated ones on day 21 compared with day 15. B, confirmation of 8 selected miRNAs by qRT-PCR analysis. Quantitative miRNA expression data were normalized to the expression levels of U6. Relative fold changes were shown as mean ± S.E.

