FIGURE 3.
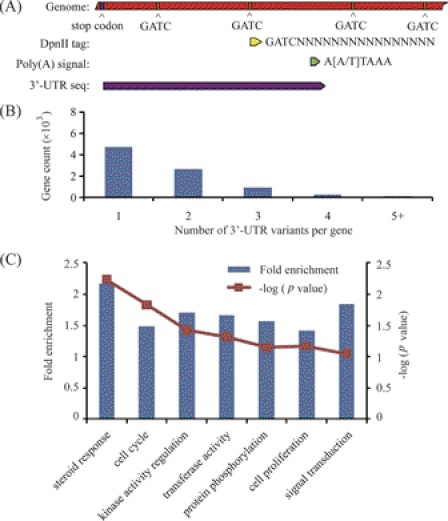
The 3′-UTRome of the rhesus monkey endometrium. A, 3′-UTRome discovery pipeline. B, distribution of 3′-UTR variants per gene. C, functional clustering and enrichment analysis of differentially expressed genes identified by tag sequencing. DAVID online tools were used for enrichment analysis. Genes were classified according to biological processes.

