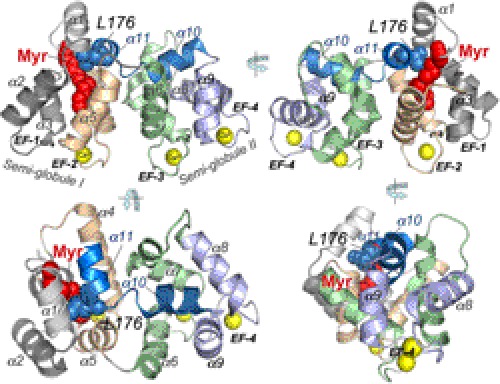
FIGURE 1.
Ca2+GCAP1 model adopted from Stephen et al. (24). The crystal structure depicts the two semiglobular portions of the molecule created by two pairs of EF-hands (EF-1 through EF-4). The α-helical regions are marked as α1 through α11. The yellow spheres represent Ca2+ ions bound in EF-hands. The Myr moiety is shown in red spheres. The cavity embedding the Myr fatty acyl chain is located in semiglobule I formed by the N-terminal EF-hands (EF-1 and EF-2). The main chain exiting as an α-helix (α9) from EF-hand 4 in semiglobule II extends back to semiglobule I via two short α-helical stretches, α10 and α11 (blue ribbons), of which the C-terminal helix, α11 (Asp175–Leu183; numeration by bovine GCAP1 sequence), is in direct contact with the Myr group via Leu176 (blue spheres).

