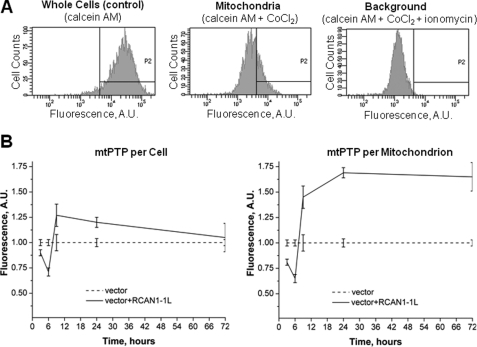
FIGURE 5.
mtPTP dynamics in dividing ST14A cells after RCAN1-1L overexpression. Cells were transfected with vector carrying RCAN1-1L fragment and with null vector (control). A, example of FACS analysis. Assays were performed in intact cells using the calcein fluorescence dye as described under “Results.” B, summary of PTP analysis. Cells were analyzed at the indicated time periods after transfection. Mean values were converted to arbitrary units (A.U.) to make the results from different experiments directly comparable with each other. Fluorescence values in samples transfected with null construct (control) were set as 1.0. Results (means ± S.E. (error bars)) represent measurements from three independent experiments. Obtained numbers represent mtPTP values per cell, which also were expressed per mitochondrion, taking into account data shown in Figs. 2 and 3. At the 3 and 6 h time points after RCAN1-1L overexpression, mtPTP values were significantly decreased either per cell or per mitochondrion (Student's t test, p < 0.05). At the 12 and 24 h time points, mtPTP values were significantly increased either per cell or per mitochondrion (Student's t test, p < 0.05). At the 72 h time point after RCAN1-1L overexpression, mtPTP values become equal as expressed per cell; however, they remained elevated when expressed per mitochondrion (Student's t test, p < 0.05).

