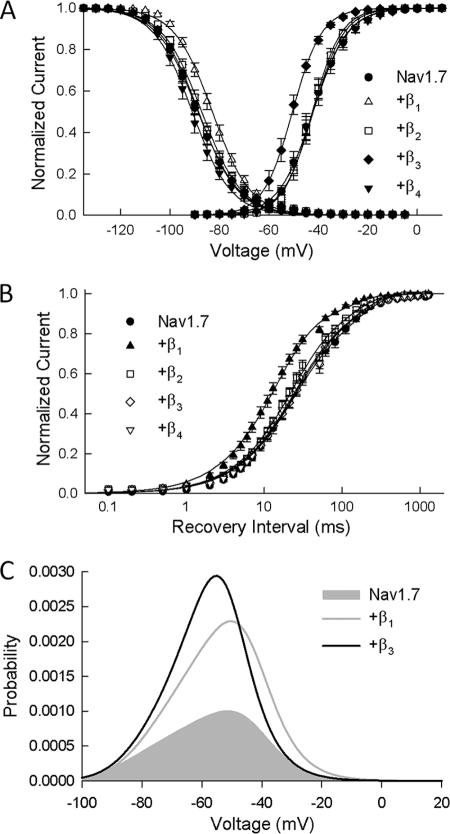
FIGURE 6.
β subunits shift activation and inactivation of Nav1. 7 channels. A, the normalized conductance was determined from the peak Na+ currents and is plotted versus the test potential. Also plotted is the steady-state inactivation obtained using 500-ms prepulses to voltages between −130 and −5 mV. The smooth curves are fits of the activation and inactivation data to Boltzmann functions with the parameters listed in Table 1. Data are the means ± S.E. of 14 (Nav1.7), 26 (β1), 9 (β2), 21 (β3), and 8 (β4) determinations. B, Na+ channels were inactivated by a brief depolarization (−30 mV/20 ms), and the recovery time course (0–1200 ms) was measured at −100 mV. The smooth curves are biexponential curve fits with the fast and slow time constants listed in Table 1. Data are the means ± S.E. of 15 (Nav1.7), 22 (β1), 10 (β2), 17 (β3), and 8 (β4) determinations. C, window current probabilities predicted from the activation and steady-state inactivation of the Nav1.7 channels expressed alone or with either the β1 or β3 subunits.

