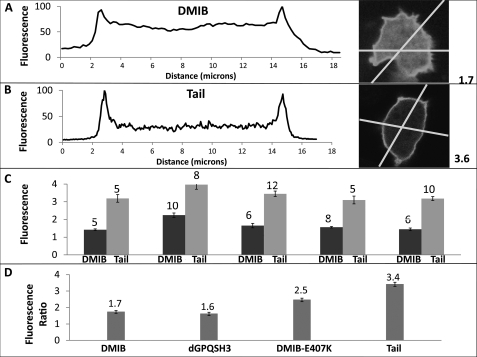
FIGURE 8.
Comparison of cytoplasmic and membrane-associated fractions of DMIB, Tail, DMIB-N154A, and dGPQSH3. A and B, fluorescence images of freshly plated Dictyostelium cells expressing DMIB or Tail were scanned. Examples of individual linear cross-scans for DMIB (A) and Tail (B) are shown. Each cell was scanned twice across two different lines. Scans were normalized for each cell taking the average maximum fluorescence intensity of membrane peaks as 100%. The ratios of the maximum fluorescence intensity on the plasma membrane to the average fluorescence intensity in the cytoplasm for single cells shown in A and B were 1.7 and 3.6, respectively, as indicated at the sides of the panels. C, ratio of the maximum fluorescence intensity on the plasma membrane to the average fluorescence intensity in the cytoplasm in five experiments. Each pair of bars represents a separate experiment, and the number of cells scanned in each experiment is indicated on the top of bars. D, average of fluorescence ratios for DMIB, dGPQSH3, DMIB-E407K, and Tail. The average fluorescence ratios are indicated at the tops of the bars. The number of scanned cells and independent experiments were as follow: 35 cells from 5 experiments for DMIB, 22 cells from 3 experiments for dGPQSH3, 30 cells from 3 experiments for DMIB-E407K, and 40 cells from 5 experiments for Tail. Error bars, S.E.

