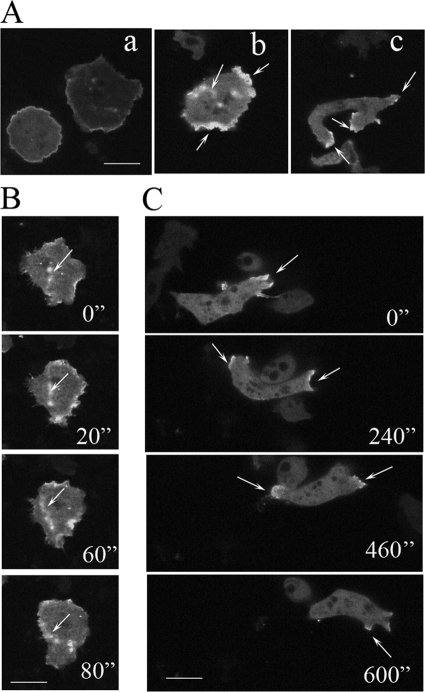
FIGURE 9.
Localization of DMIB-N154A. Aa, freshly plated cells. Ab, cells starved for 2 h. Ac, cells starved for 8 h. B, more detail of DMIB N154A distribution in cells represented by cell in Ab. C, more detail of DMIB N154A distribution in cells represented by cell in Ac. Arrows point to the sites of DMIB N154A location. Scale bars, 10 μm.

