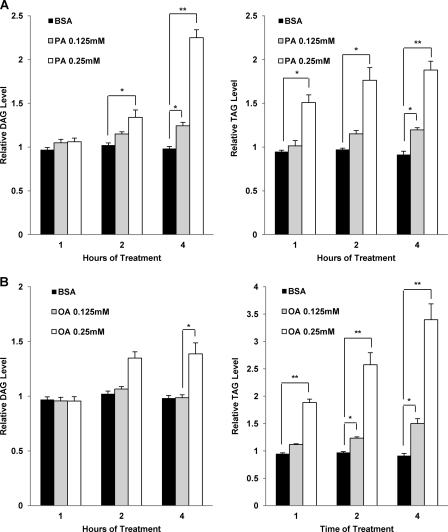
FIGURE 4.
PA and OA treatment induce differential accumulation of intracellular DAG and TAG that is both time- and dose-dependent. A, MEFs were treated with BSA control and PA (0.125 and 0.25 mm) for 1, 2, and 4 h. The total DAG (left panel) and TAG (right panel) levels were then quantified using LC-MS as described under “Experimental Procedures.” The relative DAG and TAG levels were calculated by normalizing their respective levels in each treatment at different time points to the levels present in the untreated cells. B, cells were treated with BSA control and OA (0.125 and 0.25 mm) for 1, 2, and 4 h. The total DAG (left panel) and TAG (right panel) levels were then quantified using LC-MS. The relative DAG and TAG levels were calculated as described in A. Data were presented as the means ± S.D. of three independent experiments, and Student's t tests were calculated between the BSA treated cells and either PA- or OA-treated cells at each respective time point. *, p < 0.05; **, p < 0.01, Student's t test.

