FIGURE 5.
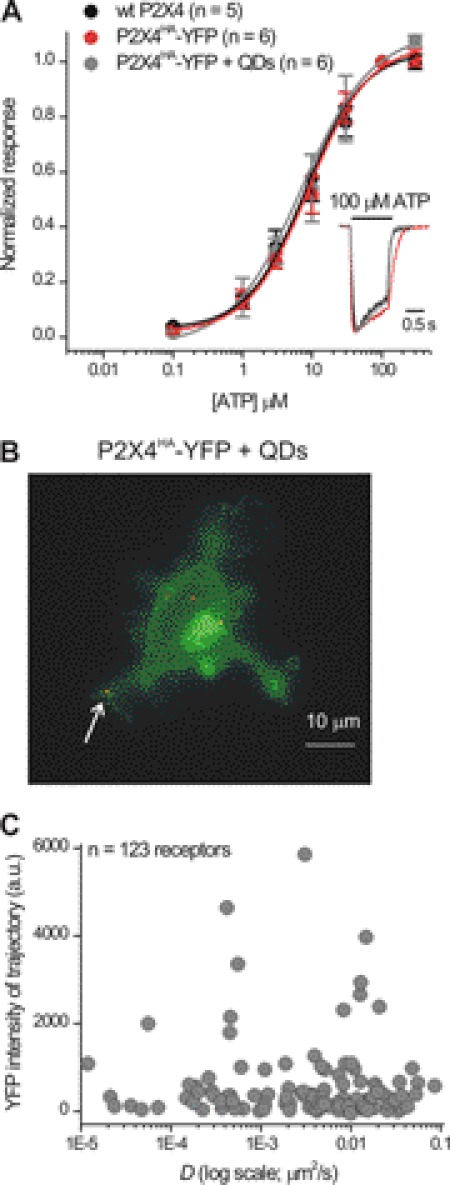
No obvious relationship between diffusion coefficient and YFP intensity over the trajectory area for QD-labeled P2X4HA-YFP receptors. A, normalized concentration-effect curves for ATP at WT P2X4, P2X4HA-YFP, and QD-labeled P2X4HA-YFP receptors in microglia (100 pm QDs were used to ensure that most receptors were bound to QDs; n = 8, 6, and 6). The inset shows normalized representative 100 μm ATP-evoked currents from the three concentration-effect curves. B shows a maximum projection over time of a microglial cell expressing P2X4HA-YFP receptors and labeled with QDs. The arrow points to QD-labeled P2X4HA receptors on processes like the ones that we analyzed in this study. C, graph shows the diffusion coefficient D plotted against the YFP intensity measured at the exact same area covered by each QD trajectory (n = 123). No correlation between the two parameters was apparent.

