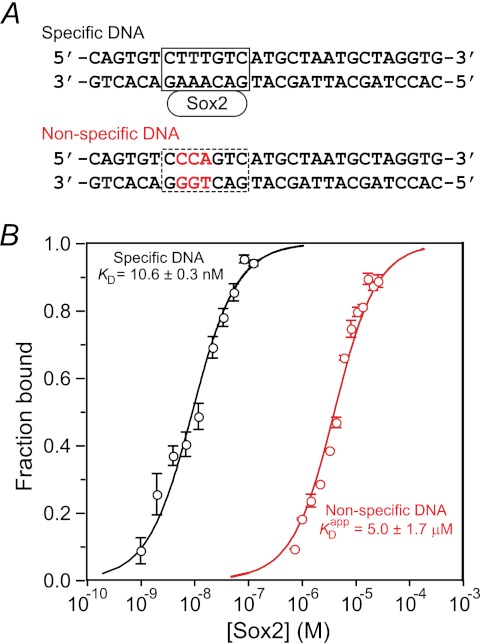
FIGURE 1.
Nonspecific binding of Sox2 to DNA monitored by fluorescence anisotropy. A, specific (top) and nonspecific (bottom) DNA duplexes. The base pairs involved in specific interactions between Sox2 and DNA are located in the box (top). The bases marked in red in the nonspecific duplex indicate sites that were mutated relative to the specific duplex. B, fluorescence anisotropy titration for the binding of Sox2 to the nonspecific DNA duplex. The rhodamine fluorescent label is conjugated to the 5′-end of the bottom strand of the nonspecific 29-bp DNA duplex. The concentration of DNA is 1.5 μm in 10 mm sodium phosphate, 150 mm NaCl, and 1 mm EDTA, pH 7.4, and 25 °C. The excitation and emission wavelengths are 550 and 580 nm, respectively. The experimental data points (error bars, S.D.) are shown as open circles in red, and the best fit curve with an apparent KDapp of 5.0 ± 1.7 μm is shown as a solid red line. For comparison, the fluorescence anisotropy titration data for the binding of Sox2 to the specific DNA duplex (taken from Ref. 14) under the same conditions of buffer, salt, and temperature are shown in black with the experimental data displayed as circles and the best fit curve with a KD of 10.6 ± 0.3 nm as a solid line. The concentration of rhodamine-labeled specific DNA used in the titration experiment was 1.4 nm.

