FIGURE 3.
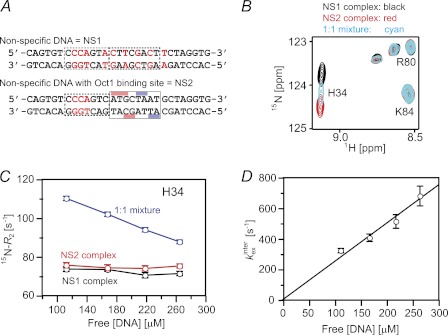
Kinetics of intermolecular translocation of Sox2 between nonspecific DNA duplexes. A, sequences of the two 29-bp nonspecific DNA duplexes denoted as NS1 and NS2. B, overlay of an expanded region of the 1H-15N HSQC spectra of 2H/15N-labeled Sox2 recorded on nonspecific complexes comprising NS1 (black), NS2 (red), and a 1:1 mixture of NS1 and NS2 (cyan) DNA duplexes. The concentration of Sox2 is 0.4 mm, the concentration of NS1 and NS2 in the individual complexes is 0.5 mm, and in the complexes comprising a 1:1 mixture of NS1 and NS2, the two DNA duplexes are at a concentration of 0.25 mm each. The NaCl concentration and temperature are 25 mm and 30 °C, respectively. C, amide 15N-R2 rates for His34 as a function of free DNA concentration. D, dependence of the overall apparent intermolecular translocation rate kexinter on the free DNA concentration. Error bars, S.D.

