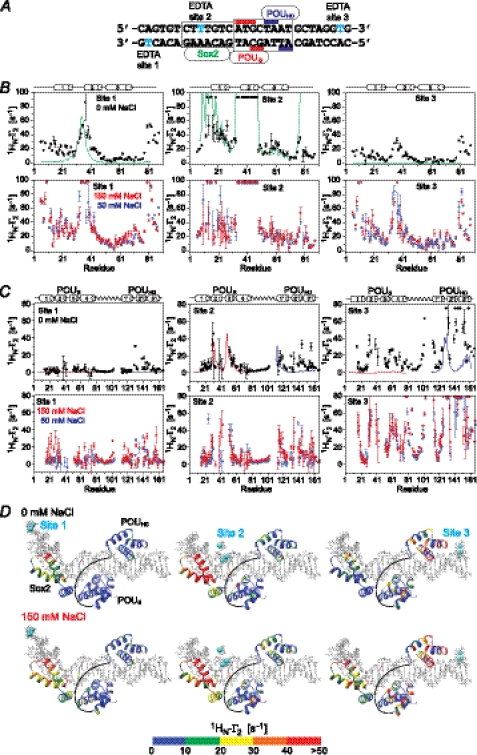
FIGURE 7.
Intermolecular PRE profiles for the specific Oct1·Sox2·Hoxb1-DNA ternary complex. A, the 29-bp DNA duplexes employed with the paramagnetic label (dT-EDTA-Mn2+) located at the ends of the duplex (site 1 or 3) or in the middle of the Sox2-specific site (site 2). B, intermolecular PRE profiles observed on 2H/15N-labeled Sox2 originating from the paramagnetic label at sites 1 (left panels), 2 (middle panels), and 3 (right panels) at 0 mm NaCl (black circles, top panels) and at 50 (blue circles), and 150 mm NaCl (red circles) (bottom panels). The concentrations of 2H/15N-Sox2, Oct1 (at natural isotopic abundance) and paramagnetically labeled DNA are 0.40, 0.44, and 0.44 mm, respectively. C, intermolecular PRE profiles observed on 2H/15N-labeled Oct1 originating from the paramagnetic label at sites 1 (left panels), 2 (middle panels), and 3 (right panels) at 0 mm NaCl (black circles, top panels) and at 50 (blue circles) and 150 mm NaCl (red circles) (bottom panels). The concentrations of 2H/15N-labeled Oct1, Sox2 (at natural isotopic abundance) and paramagnetically labeled DNA are 0.40, 0.44 and 0.44 mm, respectively. The back-calculated PREs obtained from the coordinates of the Oct1·Sox2·Hoxb1-DNA ternary complex (23) are displayed as solid lines for Sox2 (green), and the POUS (red) and POUHD (blue) domains of Oct1. The PREs are back-calculated in Xplor-NIH (37) using an ensemble representation for the paramagnetic label (30). D, experimental PRE profiles at 0 (top) and 150 mm NaCl (bottom) mapped onto the structure of the specific Oct1·Sox2·Hoxb1-DNA ternary complex (23). The color scale for the PRE 1HN-Γ2 rates is shown at the bottom. Error bars, 1 S.D.

