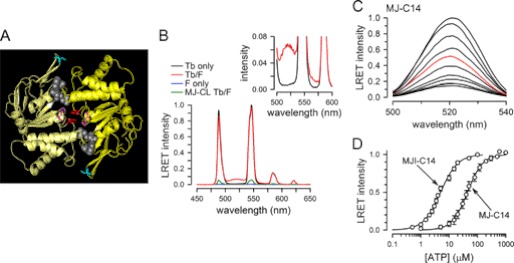
FIGURE 1.
Structure and function of NBDs. A, structure of nucleotide-bound MJI-C14. Each monomer is represented in a different yellow tone. ADP and Pi are shown in space-filling representation (gray), and Cys-14, Gln-171, and Trp-174 are shown in sticks representation (cyan, magenta, and red, respectively). This structure is based on the MJ0796-E171Q/G174W coordinates (Protein Data Bank (PDB) 3TIF). B, emission spectra from ATP-bound MJ-C14 dimers labeled with Tb3+ only (Tb only, black), fluorescein only (F only, blue), or Tb3+ and fluorescein (Tb/F, red). The emission spectrum of MJ-CL subjected to the Tb3+/fluorescein labeling procedure is also shown (MJ-CL Tb/F, green trace). The inset is a zoomed view showing the donor only (black) and donor-acceptor traces (red). Protein concentration was 2 μm, and 2 mm ATP was added 10 min before collecting the spectra. Intensities were normalized to the 546-nm MJ-C14 Tb/F Tb3+ peak, except for the Tb3+ only trace, which was scaled to the Tb3+ 585-nm peak of MJ-C14 Tb/F. C, typical MJ-C14 LRET intensity changes in response to increasing ATP concentration. The sensitized fluorescein emission was measured at ATP concentrations ranging from zero (bottom trace) to 500 μm (top trace). Intermediate ATP concentrations were 5, 10, 15, 20, 30, 40 (red), 50, 100, 200, and 500 μm. Traces correspond to data normalized to the peak emission in 500 μm ATP. The spectra were acquired at 5-min intervals between sequential ATP additions. The solutions were nominally divalent cation-free and contained 1 mm EDTA, to prevent ATP hydrolysis. D, summary of the dependence of the LRET signal on ATP concentration. The sensitized emission data were obtained from experiments similar to those in panel C and are shown as means ± S.E. (n = 5 for each protein). S.E. values smaller than the symbol size are not shown.

