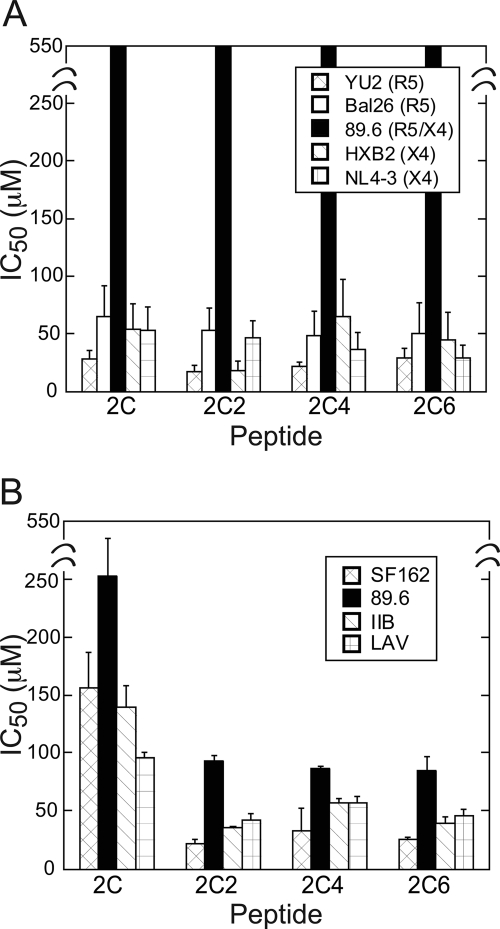
FIGURE 3.
Histograms showing relative IC50 values for 2C-TM5 peptides in neutralization (A) and cell-cell fusion (B) assays. The legend for the HIV-1 strains used is shown in the inset in A and B. Numerical values are provided in supplemental Tables S2 and S3.

