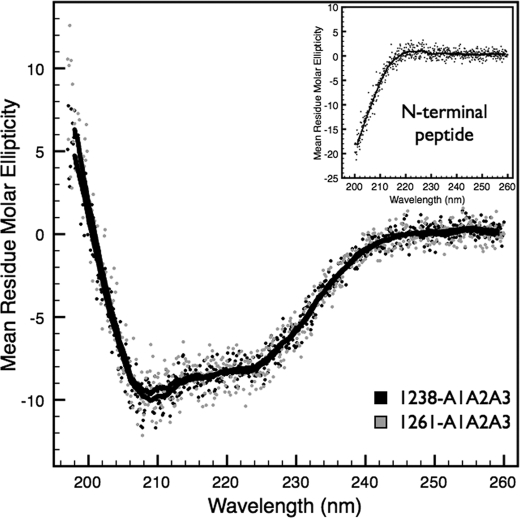
FIGURE 4.
Circular dichroism spectra. CD of 1238-A1A2A3 (black) and the N-terminally truncated 1261-A1A2A3 (gray) tri-domains were acquired at 5 °C. Mean residue molar ellipticity (deg cm2/dmol per residue) data are an average of three spectral scans of 1 μm protein taken in 0.1-nm intervals from 200 to 260 nm. Inset, spectral scan of the N-terminal peptide at 20 μm. Solid black lines are a 20-data point (2-nm window) smoothing of the data.

