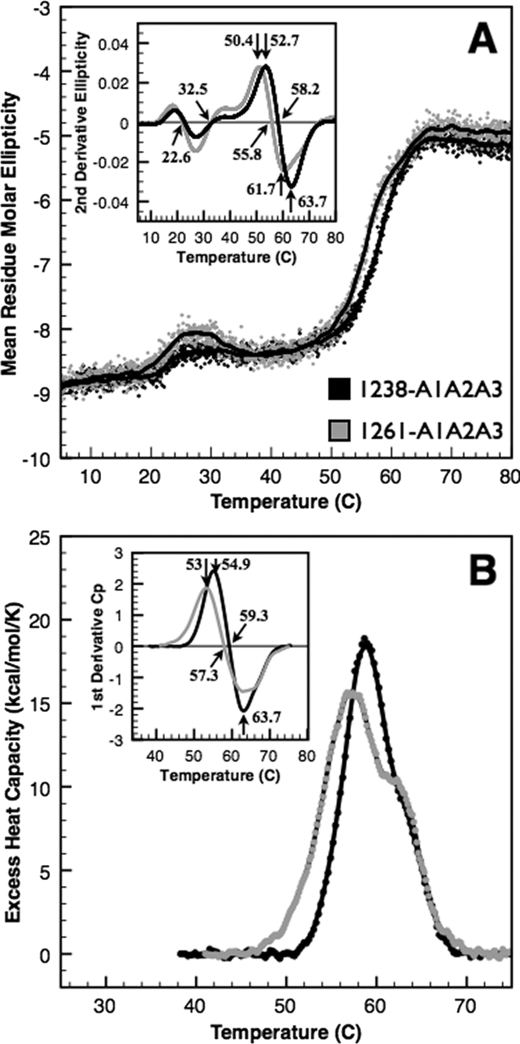
FIGURE 5.
Thermal unfolding of A1A2A3 proteins. Thermal unfolding of 1238-A1A2A3 (black) and the N-terminally truncated 1261-A1A2A3 (gray) tri-domains was monitored by CD at 222 nm (A) and by DSC (B). Mean residue molar ellipticity (deg cm2/dmol per residue) on left was obtained by continuous scanning at 1 ºC/min taking data at 3-s intervals. CD results are an average of two scans of 1.1 μm 1238-A1A2A3 and six scans of 0.6 μm 1261-A1A2A3 to minimize data scatter and maximize signal/noise ratio. Solid black lines are a 20-data point (1 ºC window) smoothing of the data. Excess heat capacity (cal/mol per K) on right was obtained by continuous scanning of ∼3 μm protein at 1 ºC/min. Low temperature transitions observed by CD were not detectable by calorimetry. Insets, second derivatives of the data identify the midpoint temperatures that comprise these overlapping transitions (see “Results”).

