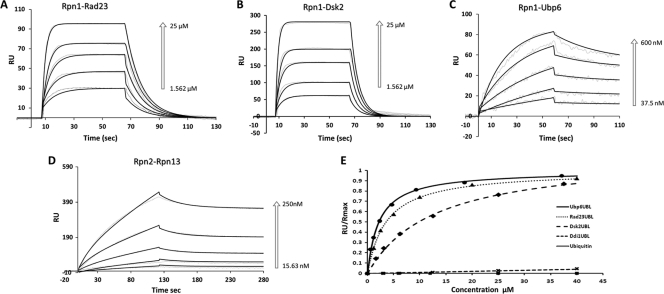
FIGURE 2.
Binding kinetics to Rpn1 or Rpn2. Rpn1 and Rpn2 were immobilized on separate channels (1700 and 1100 response units (RU)) of a ProteOn surface plasmon resonance sensor and injected with increasing concentrations of their potential binding partners followed by buffer wash. Positive associations are displayed for Rpn1-Rad23 (A), Rpn1-Dsk2 (B), Rpn1-Ubp6 (C), and Rpn2-Rpn13 (D). The response data (dashed lines) for association and dissociation are shown for a series of concentrations (arrows) overlaid with a model fit (solid line). Sensograms in A, B, and D were fit to the Langmuir model for 1:1 binding stoichiometry. Sensograms in C (Rpn1-Ubp6 response) were fit to an HLPR, assuming two-binding sites. Association (kon) and dissociation (koff) rate constants derived from a global fit of primary response data over the entire concentration range for each pair to the corresponding model are summarized in Table 1. E, binding isotherms for Ubp6UBL (circles), Rad23UBL (triangles), Dsk2UBL (diamonds), Ddi1UBL (×), and ubiquitin (squares) derived from equilibrium SPR measurements. Normalized equilibrium response is plotted as a function of soluble protein concentration; the fitting curves correspond to dissociation constants shown in Table 2.

