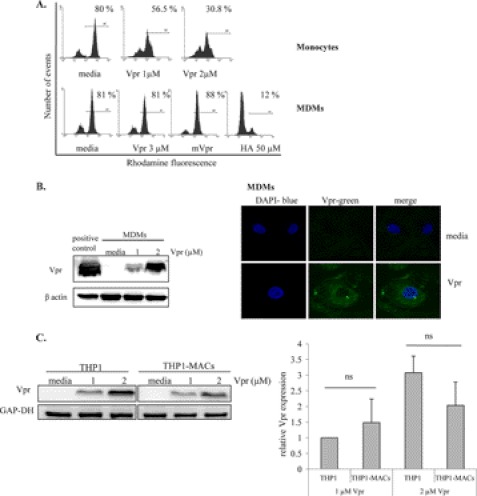
FIGURE 3.
Vpr enters MDMs without causing mitochondrial depolarization. A, MDMs and primary monocytes were treated with the indicated concentrations of Vpr, following which cells were stained with rhodamine for mitochondrial membrane potential evaluation as described under “Experimental Procedures.” Bcl2 inhibitor HA14-1 was used as a positive control and mVpr as a negative control for MDMs. Histograms show rhodamine-positive cells, indicative of live cells. Histograms show one representative experiment for three similar results. B (left), MDMs were treated with Vpr for 24 h, following which whole cell protein extracts were subjected to Western blotting. The membrane was probed with anti-Vpr antibody and anti-β actin antibody to control for protein loading. B (right), following differentiation on coverslips, MDMs were treated with Vpr for another 24 h. Cells were stained according to the protocol described under “Experimental Procedures,” and images were acquired with a Zeiss LSM 510 Meta confocal microscope using a ×63 objective. Total magnification was ×157.5. C, THP1 cells and THP1-MACs were treated with Vpr for 6 h, following which total proteins were subjected to Western blotting. The membranes were probed with anti-Vpr antibody and anti-GAP-DH antibody to control for protein loading. Vpr expression level was quantified relative to GAPDH, and the bar graph shows the mean ± S.D. (error bars) of four experiments. ns, not significant.

