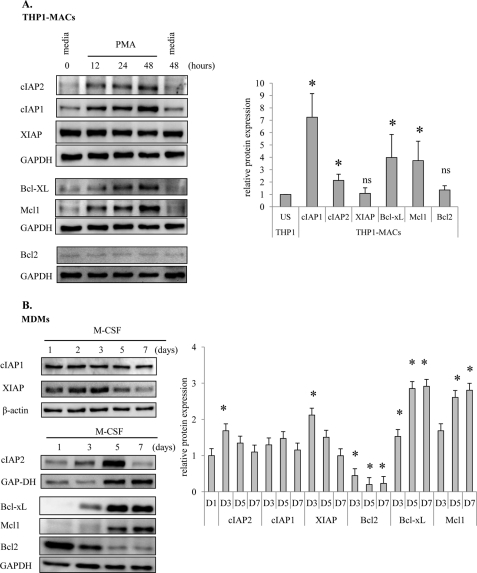
FIGURE 5.
Expression of antiapoptotic proteins during macrophage differentiation. THP1 cells (0.5 × 10⁶/ml) were differentiated with 20 ng/ml PMA (A). Monocytes isolated by adherence were differentiated with 10 ng/ml of MCSF (B). Cells were collected at the indicated times (12, 24, and 48 h for THP1-MACs and days 1, 3, 5, and 7 for MDMs) throughout differentiation, and whole cell protein extracts were subjected to Western blotting. Membranes were probed with specific antibodies against various members of the Bcl2 and IAP families, and the expression level of antiapoptotic proteins was quantified to control for equal protein loading. Right panels show the mean relative protein expression ± S.D. (error bars) of at least three experiments for each cell type at the indicated time points for MDMs (bottom right) and at 48 h for THP1-MACs (top right). *, p < 0.05; ns, not significant.

