Figure 1.

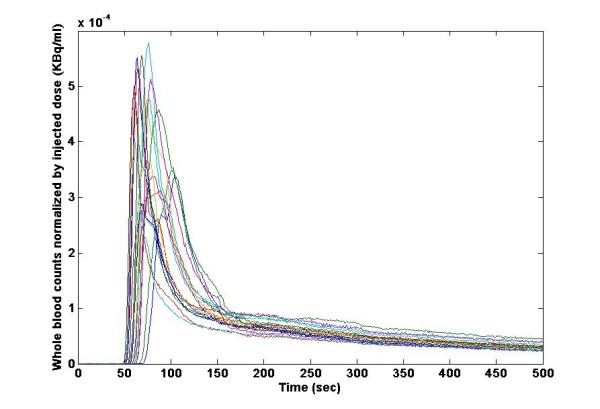
Whole blood time curves from 36 FLT scans normalised by injected dose. Arterial blood sampling was performed continuously for the first 10 min of scanning. Note the population variance.

Whole blood time curves from 36 FLT scans normalised by injected dose. Arterial blood sampling was performed continuously for the first 10 min of scanning. Note the population variance.