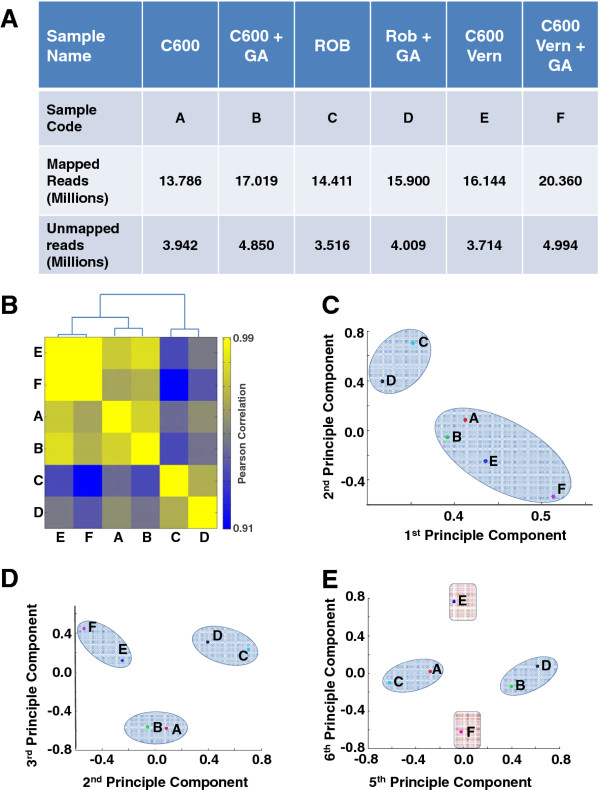
Figure 3.
Global analysis of digital gene expression profiles. A) The total number of reads that were mapped back to the reference transcriptome, together with unmapped reads, for each genotype and the sample codes designated to each treatment. B) Hierarchical clustering of digital gene expression profiles for samples shown in A) reveals a major influence of genotype on global gene expression levels. Pearson correlation coefficients were calculated for all pairwise comparisons, and displayed as a heatmap following unsupervised clustering. C) Principle component analysis of digital gene expression matrix (see methods). Principal components 1 and 2 separate samples based on genotype. D) Principle component analysis displaying components 2 and 3 which separate the vernalized and non-vernalized C600 samples. E) Principle components 5 and 6 separate samples based on GA treatment (A/C vs. B/D and E vs. F).

