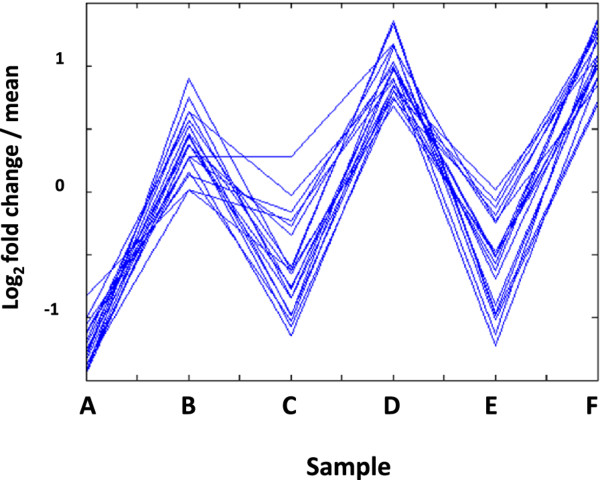
Figure 7.
Expression profiles of genes with robust GA induction under all experimental conditions. All loci that are consistently up-regulated by GA and displaying similar expression profiles across all 6 samples. A = Sample C600; B = Sample C600/+GA; C = Sample Roberta; D = Sample Roberts/+GA; E = Sample C600/vern; F = Sample C600/vern + GA.

