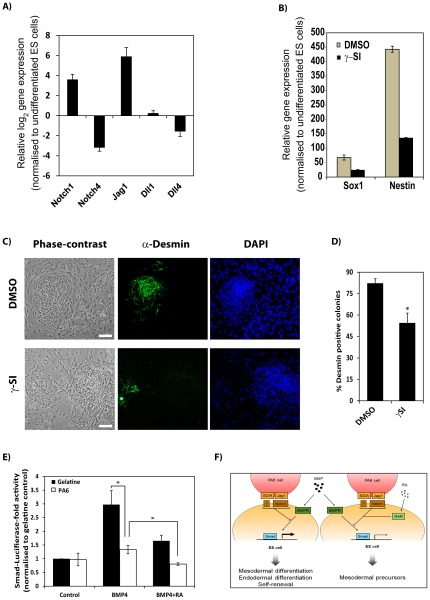
Figure 5. Repression of Smad-dependent transcription by RA and SDIA.
(A) Expression of Notch ligands and receptors in PA6, determined by qPCR, relative to their values in undifferentiated ES cells. Data are represented in log(2) scale as the average ± SEM of 3 independent RNA extractions conducted in triplicate. (B) ES cells were induced to differentiate on PA6 cells in serum-free medium in the presence of DMSO (as vehicle control) or a γ-Secretase Inhibitor (γSI) and expression of the neroectodermal markers Sox1 and Nestin was analysed by qPCR. Data are represented as the average ± SEM of a representative experiment conducted in triplicate. (C) ES cells were induced to differentiate on PA6 cells in serum-free medium supplemented with BMP4 and RA in the presence of DMSO (as vehicle control) or γ-Secretase Inhibitor (γSI). Representative micrographs show morphology of differentiated colonies (phase contrast; left hand panels) and expression of Desmin (green immunofluorescence; middle panels). DAPI was used as nuclear counterstaining (blue; right hand panels). (D) Percentage of colonies positive for Desmin, represented as the average ± SEM of 3 independent differentiation experiments. (E) Reporter assays of Smad-dependent transcription in ES cells plated either on gelatine (black bars) or mitomycin C-treated PA6 cells (white bars) and stimulated as indicated. Data were normalised to unstimulated (control) ES cells plated on gelatine and represented as the average ± SEM of 3 independent experiments conducted in triplicate. (*) p-value<0.05, n = 3. (F) Schematic illustrating crosstalk between the BMP4-, RA- and SDIA/Jag1-activated pathways in controlling ES cell differentiation. Scale bar in (C), 50 µm.

