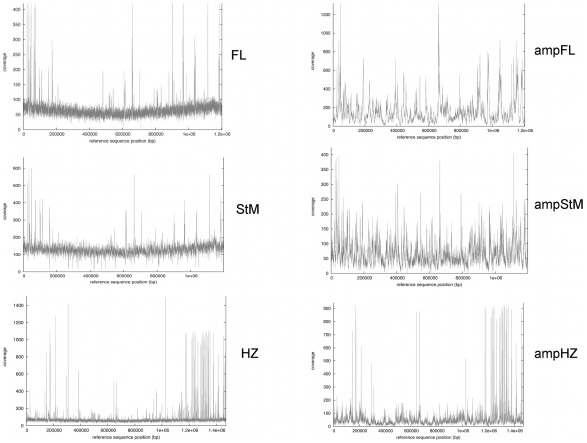
Figure 1. Genome coverage graphs of Florida (FL) and St. Maries, Idaho (StM) strains of A. marginale or the HZ strain of A. phagocytophilum.
Sequencing reads derived from either amplified or nonamplified genomic DNA were aligned with the respective homologous reference genomes using Mosaik. Coverage was obtained across the entire genomes, although coverage levels were more variable with respect to genome location using amplified DNA.

