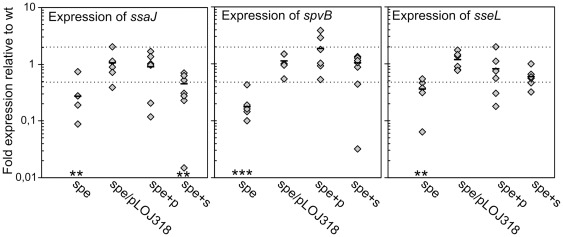
Figure 6. Expression of SPI2 genes.
Relative expression levels of selected SPI2 genes in S. Typhimurium wt, spe-mutant and the complemented spe-mutant (spe/pLOJ318). RNA was extracted from overnight M9 cultures. +p and +s denotes that the bacterial cultures have been supplemented with 100 µg ml−1 of putrescine or spermidine, respectively. A value of 1 indicates no detectable difference in expression between wt and mutant, values <1 indicate lower expression in the mutant and values >1 indicate higher expression in the mutant. Dotted lines mark the cut-off of two-fold regulation compared to wt. Results from 6 independent experiments are plotted for each strain. Outliers were removed using the Grubbs' test. Bars indicate average value of these for each strain. Significant differences between mutants and wt grown in M9 are indicated as follows: *** = P<0.0001; ** = P<0.001. The P-values were calculated by a one-way ANOVA using Dunnets post-test.

