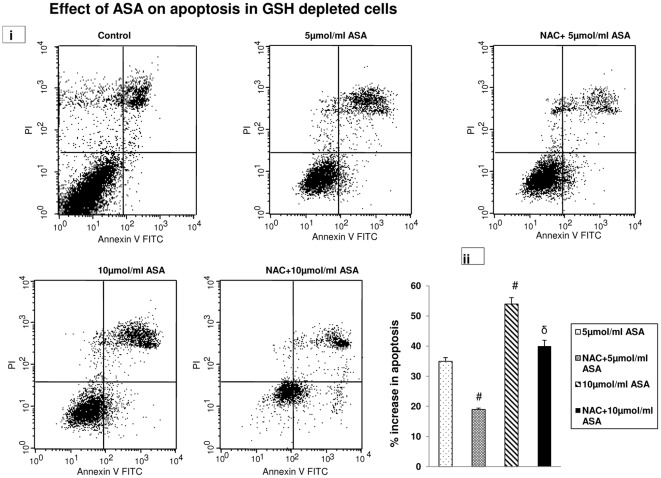
Figure 2. Aspirin-induced apoptosis.
Apoptosis in GSH depleted and NAC treated HepG2 cells were measured after ASA treatment using Flow cytometry (Figure 2i) as described in the vendor's protocol using the Becton Dickinson FACScan analyzer. Apoptotic cells were estimated by the percentage of cells that stained positive for Annexin V-FITC. Histogram showing the percentage increase in apoptosis after ASA and NAC treated GSH-depleted cells is shown in Figure 2ii. # indicate significant difference (P≤0.05) from 5 µmol/ml ASA treated group and δ indicate significant difference (P≤0.05) as compared to 10 µmol/ml ASA treated group.

