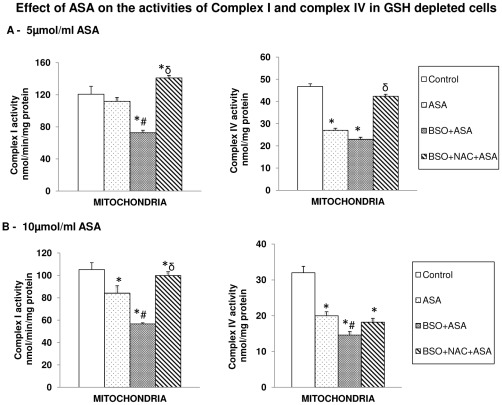
Figure 12. Aspirin-induced alterations in mitochondrial Complex I and Complex IV activities.
Freshly isolated mitochondria from control and aspirin treated HepG2 cells after BSO/NAC treatments were used to assay Complex I and cytochrome c oxidase activity as described in the Materials and Methods. (Figures 12A, B). The values are expressed as mean ± SEM of three determinations. Asterisks indicate significant difference (P≤0.05) from control values, # indicate significant difference (P≤0.05) from ASA treated group and δ indicate significant difference (P≤0.05) as compared to BSO+ASA treated group.

