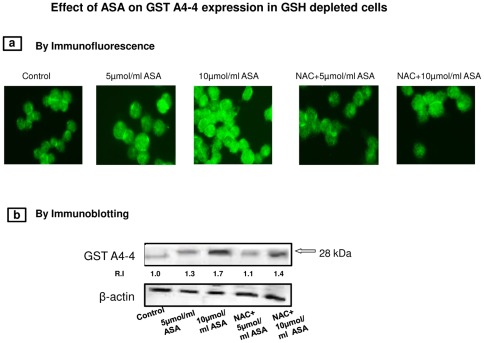
Figure 14. Immunocytochemical localization of GST A4-4.
HepG2 cells were grown on cover slips and treated with ASA after GSH depletion with or without NAC as described in the Materials and Methods. Cells were then fixed in 1% paraformaldehyde and permeabilised in 0.1% Triton X-100. Cells were incubated with 1∶300 dilution of GST A4-4 antibody followed by FITC-conjugated secondary antibody. Cover slips were then examined and photographed using an Olympus fluorescent microscope (Figure 14a). Immunoblotting was carried out using GSTA4-4 specific polyclonal antibody (Figure 14b). The quantitation of the protein bands are expressed as relative intensity (R.I) compared to the control untreated cells as 1.0. Molecular weight marker (kDa) is indicated by an arrow. β-actin was used as a loading control.

