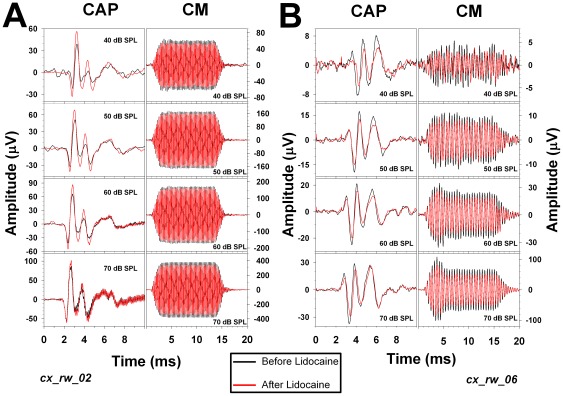
Figure 3. Examples of CAP and CM changes produced in the right cochlea after lidocaine microinjection in the left auditory cortex.
Cochlear potentials (CAP and CM) recorded before (black traces) and after (red traces) cortical deactivation. Both examples (A and B) were obtained from different chinchillas. A. Significant CAP enhancements (t = −6.42, p<0.01) and CM reductions (t = 2.51, p<0.05) after cortical microinjection of lidocaine. In this example (cx_rw_02), 4 kHz stimuli were presented at different sound pressure levels. B. Significant CAP and CM reductions (t = 3.62, p<0.05 and t = 2.92, p<0.05 respectively) following cortical microinjection with lidocaine. In this example (cx_rw_06), 2 kHz stimuli were presented at different sound pressure levels. Note that the corticofugal effects presented in this figure are larger with low intensity stimuli and that in both experiments we obtained CM reductions, but accompanied in one case by enhancements in CAP and in the other by reductions.

