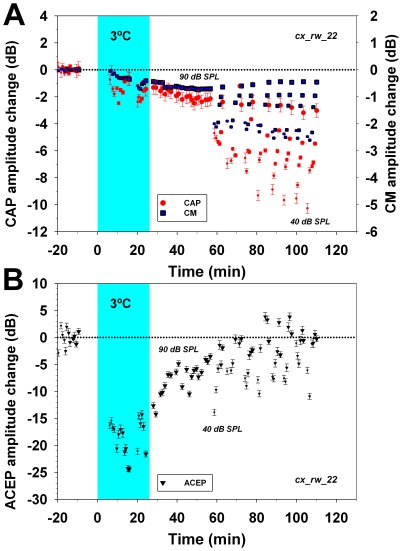
Figure 7. Temporal course of CAP, CM and ACEP changes before, during and after auditory cortex cooling at 3°C with cryoloops.
Amplitude changes in CM (blue squares), CAP (red circles) and ACEP (black triangles) are depicted in dB referenced to the mean baseline amplitude prior cortical cooling. In this experiment, 2 kHz stimuli were presented at different sound pressure levels, represented by symbols sizes increasing in 10 dB steps from 40 to 90 dB SPL. Cyan shaded areas illustrate the period of cortical cryoloop cooling at 3°C. A. Amplitude changes in cochlear potentials. Auditory cortex cooling produced significant CAP and CM amplitude reductions (F = 50.42, p<0.001 and F = 132.66, p<0.001 respectively), which were largest for low and moderate sound pressure levels. Tukey post-hoc tests revealed significant CAP and CM amplitude differences between the three periods studied (baseline, cooling and recovery). B. Auditory-cortex evoked potentials amplitude changes. Cortical cooling reduced ACEP amplitudes down to −25 dB. Note that 40 to 60 minutes after the end of cortical cooling there was a complete recovery of evoked potentials, but there was no recovery in cochlear potentials amplitudes.

