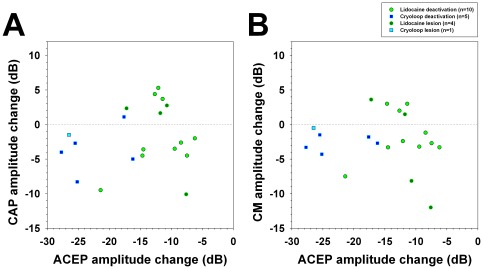
Figure 10. CAP and CM amplitude changes in function of cortical deactivation measured by ACEP attenuation.
Data from deactivation and lesion experiments were included in this figure (n = 20). A. Scatter plot of maximum ACEP and CAP amplitude changes. B. Scatter plot of maximum ACEP and CM amplitude changes. Note that CAP and CM augmentations were obtained in the same range of ACEP reductions between −10 to −20 dB, and that the cryoloop technique produced larger decreases in ACEP amplitude than lidocaine microinjections.

