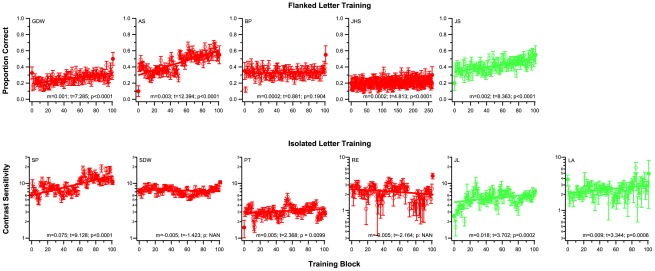
Figure 1. Training data for individual observers.
The top row shows the data for the flanked letter training group while the bottom row shows the data for the isolated letter training group. Each observer (except for JHS who was trained for 26 sessions) participated in 10 sessions of training. In all panels, each unfilled symbol represents the performance for a block of 100 trials. Filled symbols on the leftmost and rightmost edge of each panel represent the data during pre-test and post-test. Error bars represent ±1 s.e.m. Linear regression function was used to fit each set of data. The slope of this function, if different from 0 (p-value given in each panel), implies significant improvement. The slopes of the linear function for observers SDW and RE in (b) were negative, thus the p-value for improvement was listed as “NAN". Note also the change in scale on the ordinate for observers RE and LA in (b). The slope of the regression line (m), the t-statistic in calculating the significance and the p-value are given in each panel.

