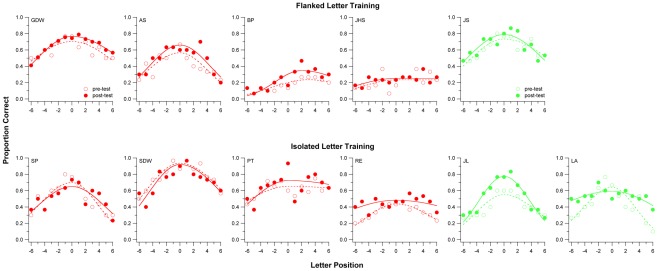
Figure 3. Proportion of correct responses in all three letters in trigrams, presented at different letter position left and right of fixation, for the task of assessing the visual span.
Data are plotted for each individual observer. Unfilled symbols represent pre-test results and filled symbols represent post-test results. The smooth curve drawn through each data-set represents a split-Gaussian function fitted to the data. The size of the visual span, akin to the measurement of the area under the curve, was quantified by first converting each proportion-correct value (from the fitted curve) to bits of information transmitted, then summing up these values across all letter positions (values plotted in Fig. 4d).

