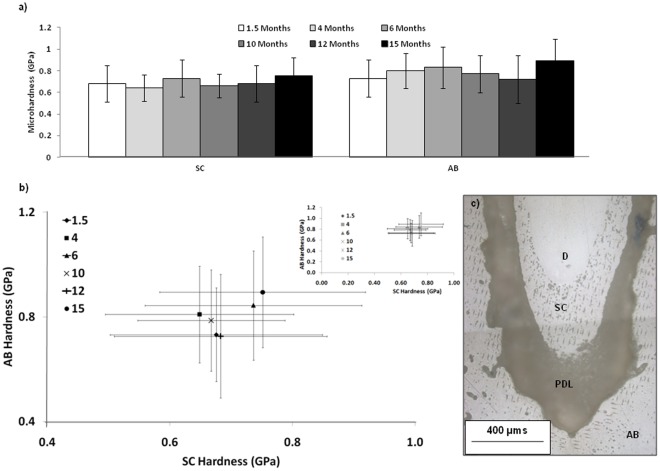
Figure 7. Hardness values for secondary cementum (SC) and alveolar bone (B) with age.
a) Histogram shows average calculated Knoop hardness and standard deviation (GPa) values for SC and B. Values demonstrated no significant differences in both SC and B microhardness with age. b) Inset demonstrates original values plotted with reference to the origin. The main plot zooms into the clustered data set to demonstrate that the discrete points showed no relationship between SC and B with progression of age. c) Typical microindentation distribution and pattern conducted under dry conditions is shown at 10X.

