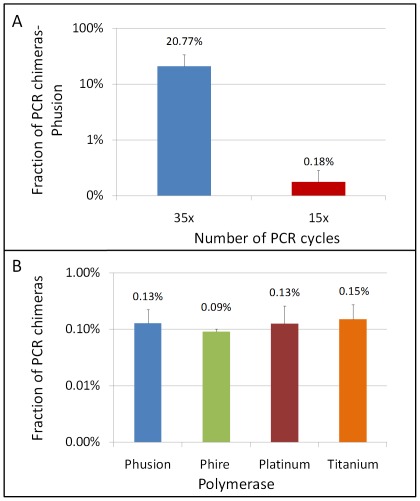
Figure 4. Assessment of chimeras formed during PCR.
A. Comparison of the fraction of false recombinants measured in 400–2200 bp templates amplified with Phusion polymerase using either 35 or 15 PCR cycles. The fractions are averages estimated from at least 5 independent experiments using different template lengths (error bars are the estimated standard deviation). B. Fraction of false recombinants measured in 422 base pair PCR products amplified for 15 cycles by different polymerases. The fractions are averages estimated from three independent experiments and error bars are the estimated standard deviations.

