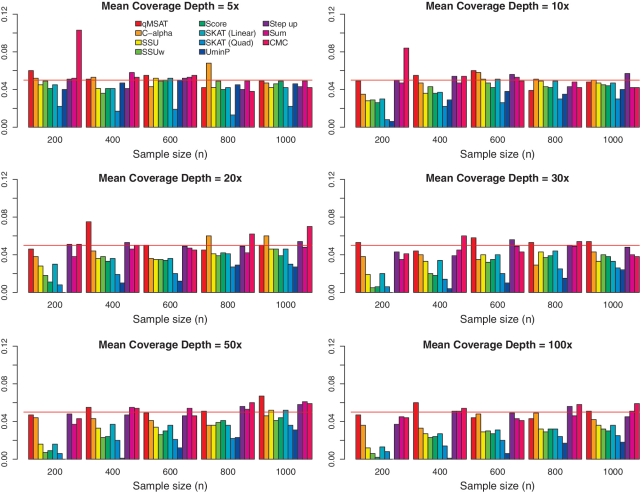
Figure 2.
Type I errors over varying coverage depths and sample sizes at MAF=0.5%. There are n/2 numbers of cases and controls each. Twenty non-causal rare variants (d = 20) are considered with odds ratios at 1 for all variants. No LD is assumed among the variants. Reference lines (in red) are drawn at the 0.05 error rate.

