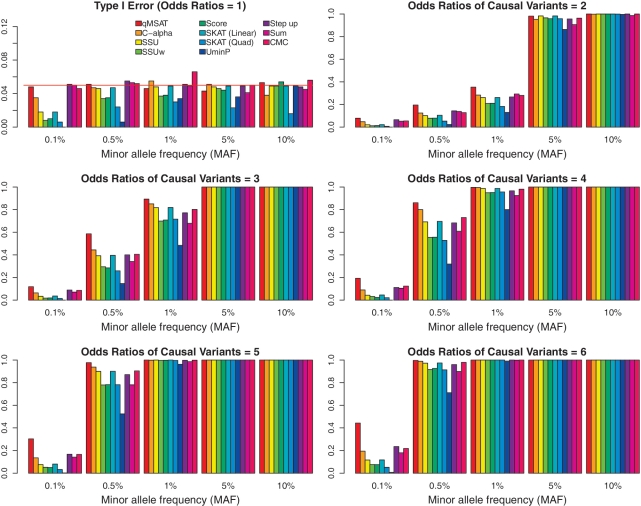
Figure 4.
Effects of MAFs and odds ratios at a mean coverage depth of 30×. Empirical powers and type I errors are presented at a mean coverage depth of 30× with varying MAFs and odds ratios for five variants amongst twenty (d = 20) considered altogether. We use n = 500 observations, where there are n/2 = 250 numbers of cases and controls each. No LD is assumed among the variants. Reference lines (in red) are drawn at the 0.05 error rate.

