Figure 1.
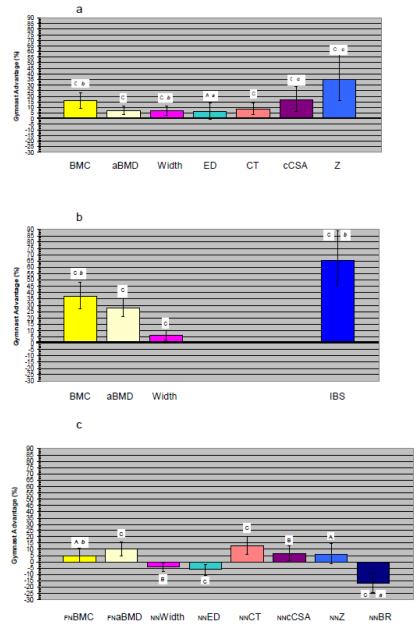
ANCOVA Main Effect Results for Gymnastic Exposure, displayed as Gymnast Percent Advantages. For each figure, columns represent the mean percent advantage of Gymnasts relative to Non-gymnasts as the zero reference line. Error bars represent 95% confidence intervals around the mean Gymnast percent advantage. All means are adjusted for age, height, total body non-bone lean mass and percent body fat. Figure 1a presents 1/3 Radius results; Figure 1b presents Ultradistal Radius results; Figure 1c presents Femoral Neck and Narrow Neck results. Capital letters denote significance of main effect of gymnastic exposure on bone outcome; small italic letters denote significance of maturity × activity interaction. A/a= p< 0.05; B/b= p≤ 0.01; C/c= p ≤ 0.001. Columns are aligned vertically in order to improve ease of comparison of analogous/similar results across the three skeletal sites. However, it should be noted that CSAs differ slightly (1/3 cCSA is cortical cross-sectional area only, with no trabecular tissue represented at this site; NNbCSA is total bone tissue cross-sectional area, including both cortical and trabecular tissue, but excluding non-bone tissue). Similarly, indices of bone strength (at far right) vary across sites [Z (section modulus, 1/3 and NN), IBS (axial compressive strength, UD only), BR (buckling ratio, NN only, lower value indicates lower fracture risk)]. FN BMC and FN aBMD results have been corrected for fan beam magnification error.

